Returning to my critique of http://xtronics.com/reference/globalwarming.htm and starting where I left off...
"Cosmic Rays"
This section includes a muddled reference to Svensmark and his belief that "the planet is experiencing a natural period of low cloud cover due to fewer cosmic rays entering the atmosphere" (which has what to do with AGW?) and that Svensmark doesn't know any more than the "warmers" because of "confounding variables". More drivel. He then includes a link to a paper on "Gamma Rays and Climate" which is a dead link. I searched for some other reference to this paper and found numerous ones to the same dead link and another dead link on the Great Global Warming Swindle site. But the GGWS link seemed to include the author's name ("Perry, Charles") and a quick search on his papers revealed a 2007 study by Charles A. Perry entitled "Evidence for a physical linkage between galactic cosmic rays and regional climate time series" (see this link for a free version) which is conveniently discussed on SkepticalScience.com. It is clear that Mr. Transtronics included this reference simply because it appears to have something to do with how "cosmic rays" cause climate change (a theory that is very popular with AGW skeptics, but which has been totally discredited in the scientific community). But this particular paper by C.A. Perry actually talks about links between "cosmic rays" and precipitation in certain regional climates around the world, not climate change. And it has one of the weakest and most questionable dependencies on "correlations" I've ever seen (Perry himself says the correlations were "unexpected" and their "validity questioned"). So the reference to this article is meaningless on several levels.
"Are the Climate Papers Properly Peer Reviewed?"
Here, among other things, Mr. Transtronics introduces us to the ClimateAudit.org web site run by mathematician Steve McIntyre of NASA's Goddard Institute. McIntyre, along with economist Ross McKitrick were at the center of a controversy over a graphic that appeared in the 2001 IPCC Third Assessment Report (TAR), generally referred to as the "Hockey Stick" graph because of the sharp rise in temperatures it depicted (see reproduction of the graph here). The graph caught the attention of the AGW skeptic crowd because it seemed to be departure from previous graphical representations of the temperature record that showed more pronounced warming and cooling over the past 1000 years or so (namely the Medieval Warming Period, or MWP, and the Little Ice Age, or LIA). The MWP and LIA were cornerstones of the skeptic's view of climate change as these were often used to illustrate how climate is cyclical and therefore the current warming trends could be dismissed as just part of an overall, natural cycle of warming and cooling.
So it was that McIntyre and McKitrick (M&M) came to investigate the origins of the graph both in terms of the data it used and the statistical methods it employed to create it's "smoothed" trend line. The controversy probably never would have gotten off the ground if it hadn't been for some mistakes made by one of the authors of the graph, Michael Mann, the first being that when he originally posted the data archive for the graph back in 1998 he had not archived the entire data set. So when M&M tried to reconstruct the graph from the data he archived, they failed. Very quickly, the skeptics began to jump on this as proof that the graph was a "fraud" and that the entire AGW theory was a hoax. The correct data was eventually provided, but over the course of the controversy, any semblance of a reasonable scientific discourse was lost and it instead turned into mud-slinging and name-calling on both sides.
The second mistake that Mann made was that he stopped cooperating with M&M, which lead to further accusations of trying to hide a conspiracy to commit fraud. And the final mistake that Mann made was to employ a specific statistical method for the "smoothed" trend line that, although perfectly legitimate from a mathematical perspective, did seem to be selected specifically because it exaggerated the "hockey stick" shape of the graph.
All this came to a head when Senator Inhofe, then Charmian of the Senate Committee on the Environment and Public Works, called the threat of catastrophic Global Warming the "greatest hoax ever perpetrated on the American people" and subsequently the Congress called for two separate investigations into the Hockey Stick graph in order to get at the "truth". The silliness about all this is that the graph itself was just one of many graphs that depicted the then-current temperatures as the highest in at least several hundred if not several thousand years. The entire graph could have been thrown out and the conclusions of the 2001 TAR (and the later and much more convincing 2007 AR4) would not have changed a bit.
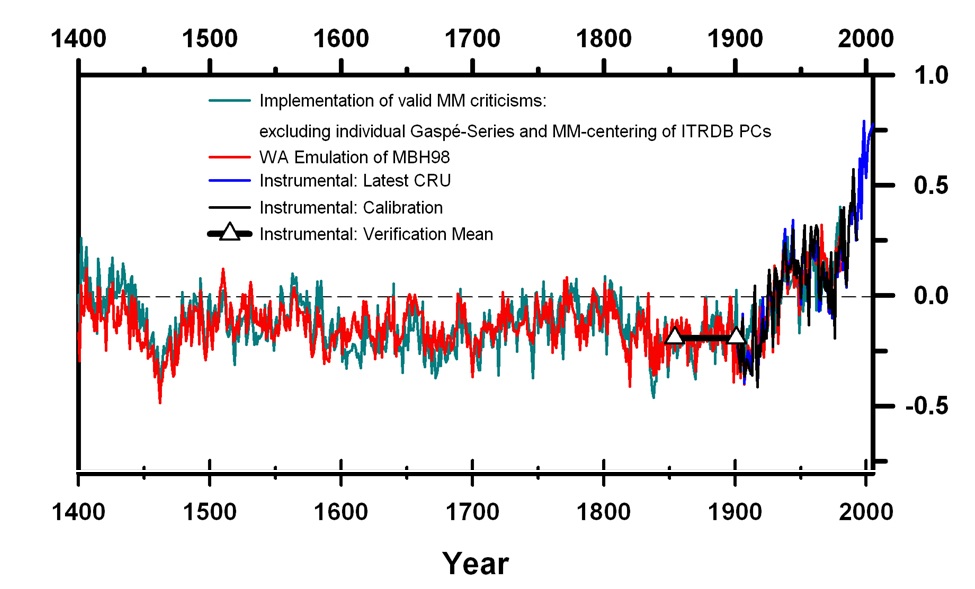
Nonetheless, the non-partisan National Research Council published its findings in 2006 and for the most part confirmed the primary conclusions of the graph that there is a "high level of confidence" that the "global mean surface temperature was higher during the last few decades of the 20th century than during any comparable period during the preceding four centuries". The confidence in temperature records prior to the last 400 years is smaller, but that "many, but not all, individual locations were higher during the past 25 years than during any period of comparable length since A.D. 900". The second report, called the Wegman Report, was more critical of both the conclusions and the methodologies of the graph and the corresponding 1998 study by Mann et. al. But in the end, the most telling point is made by the folks at RealClimate wherein they indicate that even if all the criticisms of the graphs statistical methods were corrected in the way the skeptics say it should have been done, the resulting graph still looks remarkably like a hockey stick.
Since the whole hockey stick controversy, McIntyre has continued to challenge and question all sorts of data gathering and analysis methods used by climatologists. Nothing has risen to the point of controversy as the hockey stick graph, but that doesn't keep ClimateAudit.org from continuing to try. The good part is that the whole hockey stick controversy, although painful, has helped to make the climatologists much more methodical in their data gathering and analysis. So as hard as these skeptics have tried to undermine the theory of AGW, in the end they have only helped to strengthen it.
More to come...
Subscribe to:
Post Comments (Atom)
No comments:
Post a Comment